How can we help you?
“A picture is worth a thousand words.” Charts provide a business with the satisfaction of allowing viewers to differentiate and compare large volumes of data to understand information faster.
Titan Web helps improve charts with the Word add-in. The Word add-in integrates seamlessly with Salesforce and is made to suit your individual needs, and the requirements of your project.
Make sure that you configure the chart before you use the feature in Word.
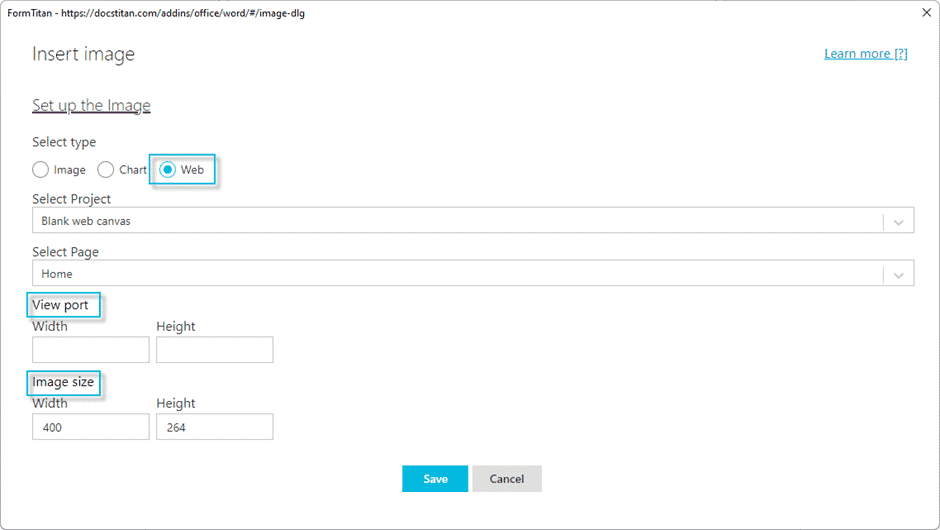
The View port is the window into the Web project. Use this when you have multiple strips on a page.
It is recommended that you use only one strip with only one chart on a page.
Make sure that your Word document has at least one Salesforce field, otherwise you will see the following error: “There are no filters, please add Salesforce objects to the document”.


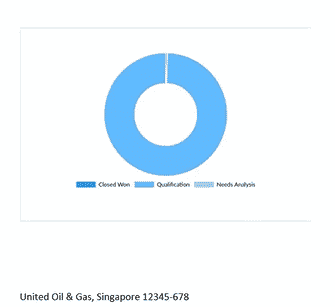
The chart is shown in the Word document.
A document is generated, for instance, in Salesforce. The RecordID of the object in Salesforce is passed from Salesforce to the Word template. All the merge fields in the Word Document are filled with Salesforce data. The RecordID is sent to the Web project that will be used to generate the chart. This information will be pushed back to the Word template.
This example uses a chart, but you can also add another type of element, for instance, a table, container or widget.
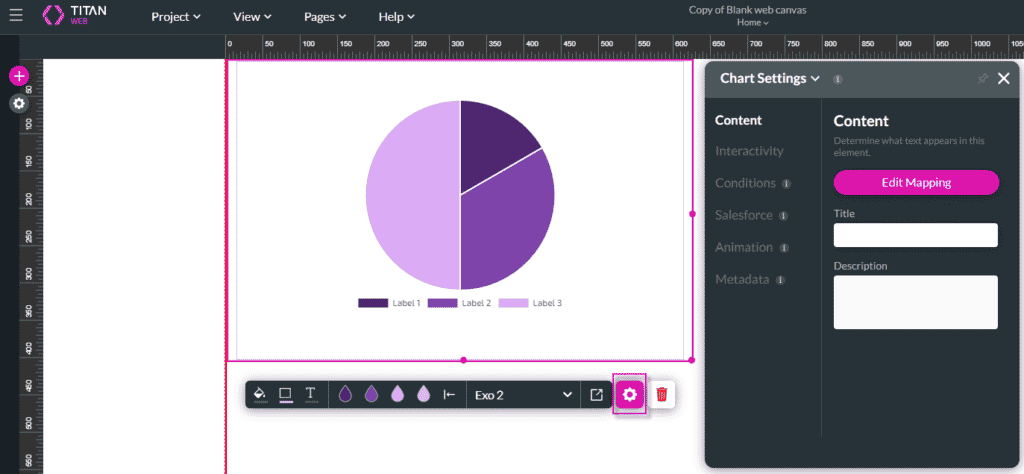
The following must be done in the Web project.
Create only one chart per page in the Web project. If you want multiple charts in your web project, place each chart on a new page.


The chart for a specific account is shown.